Trading involves many different factors, but one that’s often overlooked is the idea of volume. Volume is one of the essential metrics for traders. If you don’t know what volume is in trading and why it’s important, your good trading decision might be affected.
What is Volume?
Volume is the number of assets traded in the market at a specific time. It also indicates whether the activity or interest is high or low, so it can help you predict market trends and identify potential opportunities.
Traders use volume to identify when a stock or crypto might be trending upwards or downwards. It helps them decide when to buy or sell their stocks or crypto-assets.
On most stocks or crypto exchanges, you can find the volume in the lower part of the chart. They are usually represented in a bar graph.
Here are some of the essential key points to remember about volume:
Bullish Signals
The volume must also increase as the price increases to validate if it is an uptrend/bullish.
For this example, let’s look at the bitcoin chart between April 2019 and July 2019, where the bitcoin price dramatically increases from $4000 to almost $14000 (250% increase). The volume increase does not have to be bar by bar but higher than average.
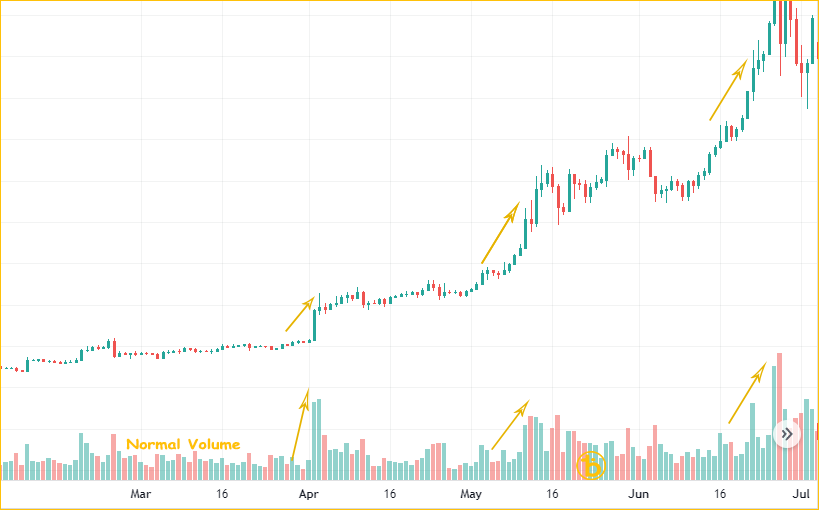
As we can see in the chart, every price increase is backed up with increased volume. To validate the trend, the price must not go back to the price where the significant increase happened, or there’s only a slight price decrease (pullback).
Pullback
Pullback happens when the market starts to reverse and pull back from a recent high. Traders need to identify these pullbacks to take advantage of them. The best method to do this is by watching the volume on the chart. If you see a low volume during a pullback, the price will likely continue moving higher.
Let’s look for another example at the Dogecoin chart between April 2021 and May 2021, where there’s a massive increase in its price.
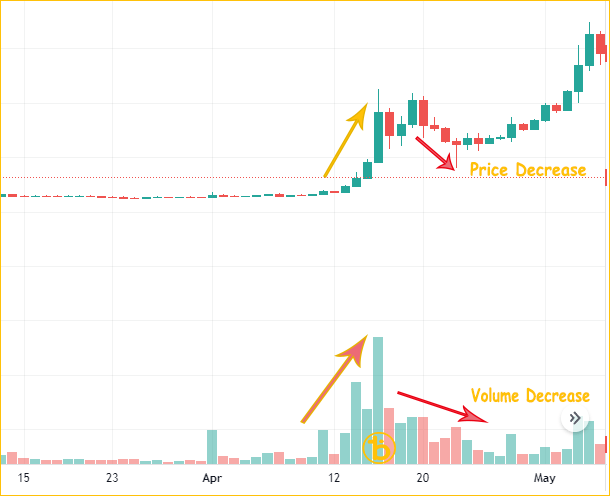
From what we see in the chart, the Dogecoin price decreases after the massive increase, but the volume also decreases. These signs validate a healthy pullback, and a possible trend continuation might happen. As we can see from what happened after, the price continues to go up after the pullback.
Bearish Signals
The volume increases when the price decreases to validate a downtrend/bearish. This indicates that many traders are participating in the sell-off, and the price might continue to go down.
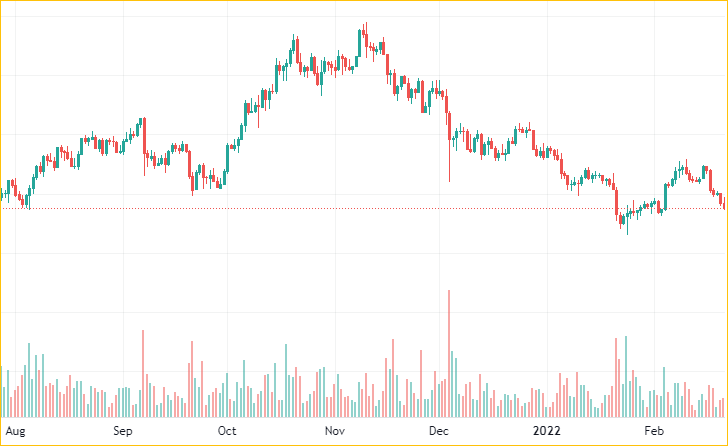
For this example, let’s look at the example chart where the price decreases.
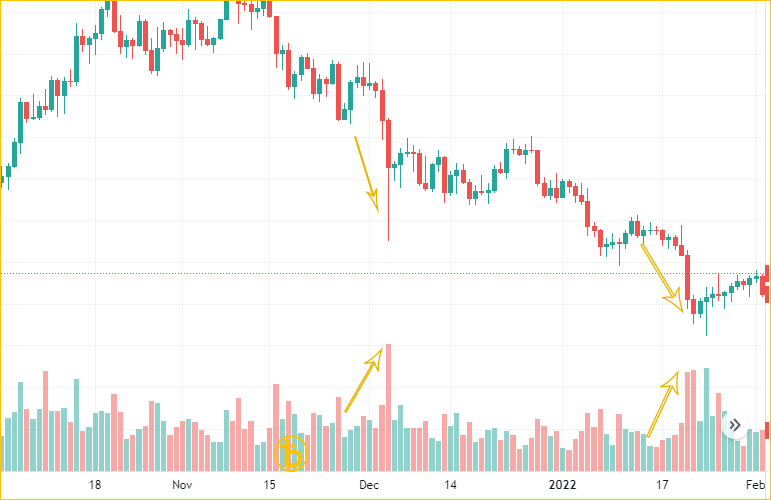
From what we see in the chart, every price decrease is accompanied by an increase in volume. These signs validate a downtrend move, and the price might continue to go down.
Breakout
When a breakout happens, the volume must be double or more than double the average volume. The price must not go back to the resistance price level after the breakout to validate a successful breakout.
For this example, we will look at the bitcoin chart on October 21, 2020, where bitcoin breaks out on its 12000+ price resistance level.
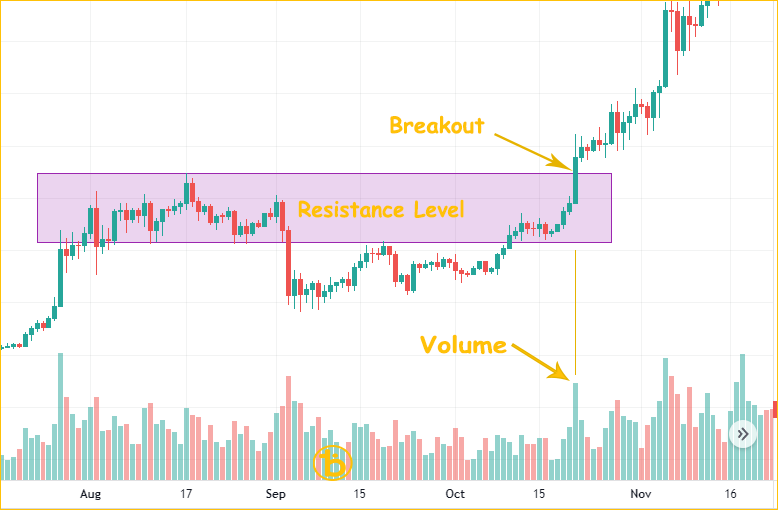
As we can see on the chart, there’s an increase in volume when the price breaks the resistance, and the price doesn’t go back to the resistance level and stays above the resistance level. It indicates that the breakout is successful.
Conclusion
Understanding how volume in trading works is a crucial element in any trade, and it’s an essential part of your strategy that needs to be handled in-depth. Volume is a key metric for traders and investors, and it can tell what’s going on with the market, better understand the market trends, and make better investment decisions.