Understanding how Candlesticks works is one of the essential parts of learning to trade, and sometimes it can be confusing, especially for beginners. But once you understand how to use them, they will help you make good trading decisions.
What are Candlesticks?
Candlesticks are the most well-known charting technique in the financial markets. It can be white or black (green or red on colored charts), depending on whether the candle’s closing price was higher or lower than the open price. Its shape can indicate trends and reversals in trading patterns.
A candlestick consists of two parts: the Body, the solid part of the candle, and the Wick (Tail), which are short/long lines on the ends of the candle.
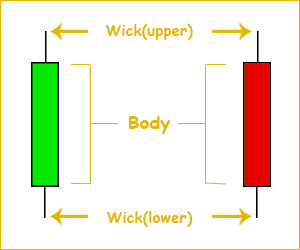
Sometimes, there are instances that a candle has no wick or body.
On a daily time frame, the candlestick shows the opening, high, low, and closing price for the day.
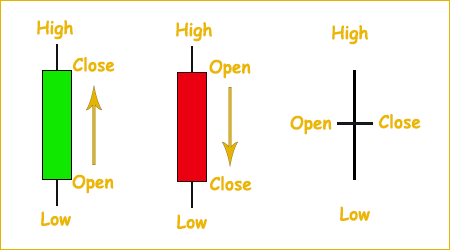
The Open / Opening Price is the price where the first trade happens.
The Close / Closing price is the price that trading closes at.
The High is the highest point that the price reaches during the trade.
The Low is the lowest point that the price reaches during the trade.
Important Key Points in Interpreting a Candlestick
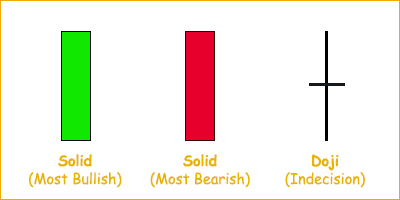
Color of a Candle:
-
- The candle’s color is associated with the market’s sentiment.
- Green is associated with a bullish sentiment.
- Red is associated with a bearish sentiment.
Size of a Candle:
-
- Long Green Candle is more bullish.
- Long Red Candle is more bearish.